Visualizing Earth’s Seismicity
From Seismic Data to Immersive Collaborative Insight
January 2026
We transformed a global seismic catalog into an interactive 3D visualization. Through this approach, we converted hundreds of thousands of raw data points into a powerful analytical tool. In collaboration with OSUNA, we developed a new way to explore seismic data visualization at global scale.
This project represents Phase 1 of an innovative research program. Currently, we are developing new spatial analysis methodologies. Our goal: transform scientific catalogs into interactive exploratory environments.
Scale & Complexity
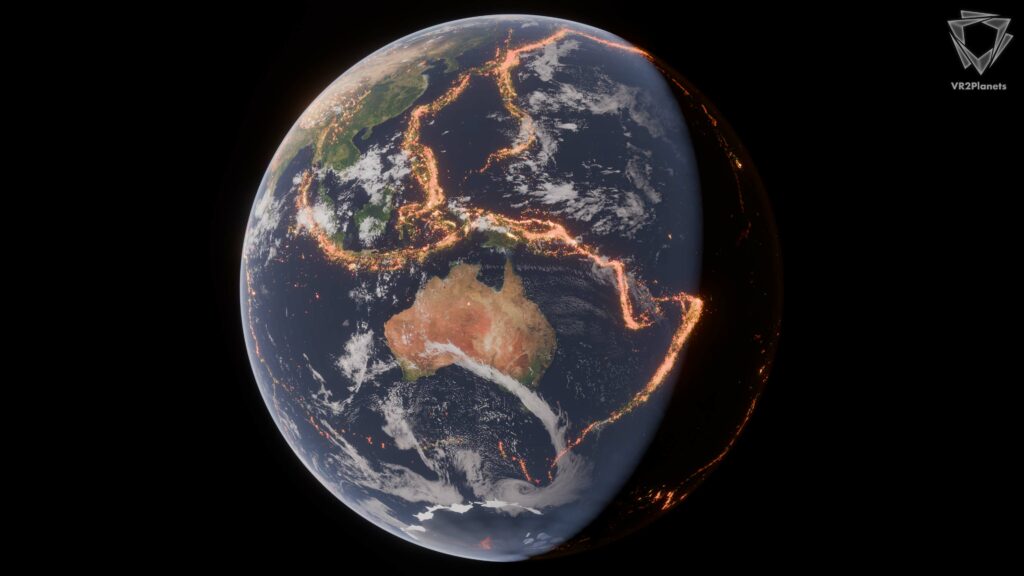
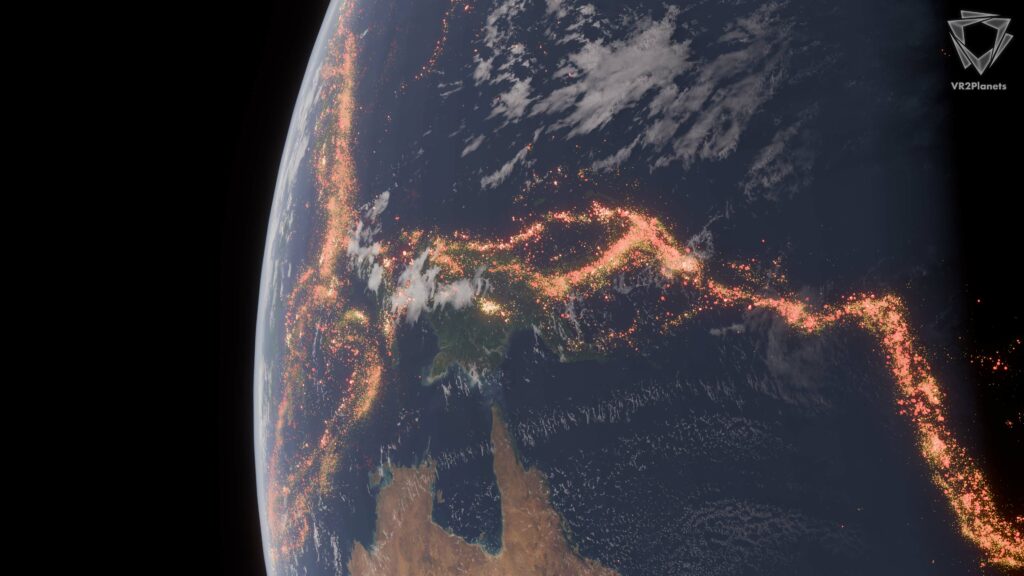
The dataset covers seismic activity across the entire planet from 1964 to 2025. Specifically, it represents over 520,000 georeferenced events. Magnitudes range from 4.0 to 9.1. Meanwhile, depths extend from the surface down to 735km.
At this scale, the visualization reveals major geological structures. Indeed, the world’s major tectonic fault lines emerge naturally from the point cloud. Consequently, this emergence results directly from the density and spatial distribution of the data.
3D Visualization
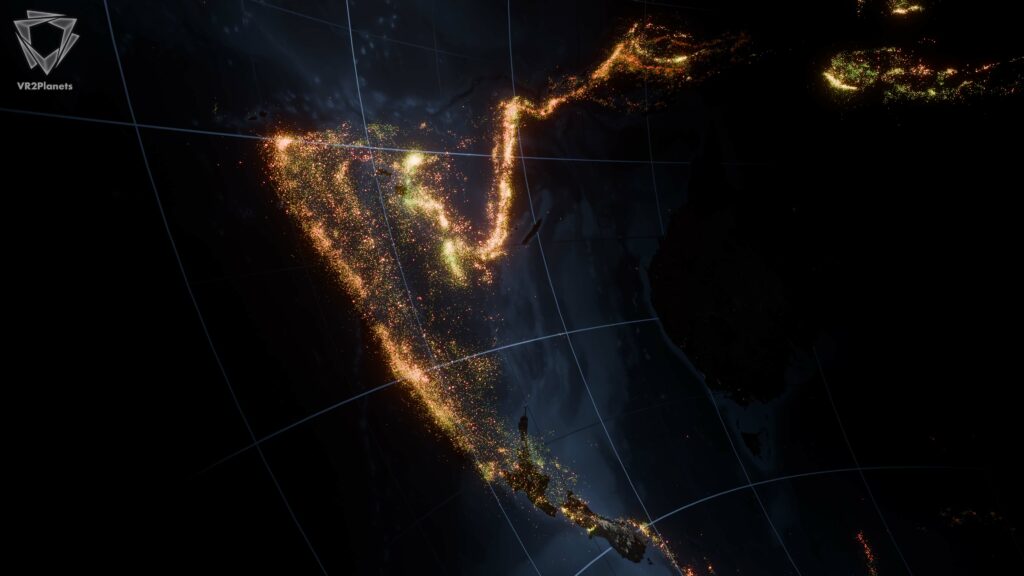
Faced with this data volume, conventional methods show their limits. In response, our pipeline generates a 3D representation from raw seismic catalogs. As a result, this approach allows simultaneous analysis of three critical dimensions: depth, magnitude, and spatial distribution.
For the OSUNA team, we achieved a decisive milestone. They discovered their data at an unprecedented scale and clarity. Moreover, this work was presented at the Le Mans Sonore 2026 biennale. The presentation took the form of Terra Vibrato, an immersive art-science creation. Specifically, it combines audio, video, and solid vibrations to raise public awareness of Earth’s seismic activity.
VRExplorer — Collaborative Immersive Analysis
We deployed the visualization through VRExplorer, our multi-user immersive platform. Thus, multiple experts can explore the same scene simultaneously, in real time. They use either virtual reality or a standard 2D screen.
Result: no hardware barrier limits collaboration. Instead, teams access complex data directly in a shared spatial environment.
FUNDERS